Georgia, Inland Waterways, National Category
Startup Uses Drone for Cleaning Water, Collecting Data


America’s more than 98,000 public PK–12 schools serve 49.4 million students. However, these buildings that America’s children rely on are aging. Nationwide, schools average 49 years old, but detailed data on their condition is scarce. Only 10% of total school spending in School Year (SY) 2021–2022 was directed to facility expenses, a total that has been low for decades, and a majority of which is dedicated toward new construction versus maintenance of existing buildings. The annual funding gap to reach a state of good repair for the nation’s public schools has grown from $60 billion in 2016 to $85 billion in 2021. Critical needs at school buildings include water upgrades to remove lead and installation of cooling systems amid increasing temperatures. A 2021 study estimated that 13,700 additional schools must add air conditioning, representing more than $40 billion in investment needs. Moving forward, better management of existing assets will be needed along with the most up-to-date building codes and standards. Those upgrades can be accommodated with high-quality public data on school facilities and greater predictable funding dedicated to infrastructure.
In SY21–22, 49.4 million American students attended more than 98,000 public schools, from prekindergarten through high school, in more than 13,300 school districts. Most school facilities are governed and managed locally, where school boards set capital investment plans and approve budgets. The physical infrastructure of schools is occasionally a topic for oversight and regulation at the state level. The federal government provides relatively minimal regulation and funding for school infrastructure, which is left almost exclusively to local government.

saw school enrollment increases
between 2019 and 2021
will need air conditioning because of
higher daytime temperatures
76% of local school bond or tax measures
during elections

America’s public school facilities can currently accommodate the overall student population and are expected to continue to meet needs over the next decade, given enrollment trends and resident birth rates. Therefore, although school capacity issues exist, they tend to be localized.
America’s public school facilities can currently accommodate the overall student population and are expected to continue to meet needs over the next decade, given enrollment trends and resident birth rates. Therefore, although school capacity issues exist, they tend to be localized.
In SY21–22, schools saw a 3% enrollment decrease across all public PK–12 pupils from SY19–20, measured before the COVID-19 pandemic disrupted school operations.2 Some public school children may have moved to private school alternatives during COVID-19, but not in large numbers based on U.S. Department of Education data. The U.S. Department of Education projects that public school enrollment nationally will slowly decline to 46.9 million in SY31–32 from 49.4 million a decade prior.
[caption id="attachment_19414" align="aligncenter" width="1500"] Change in Public School Enrollment between Fall 2019 to Fall 2021, by State
Source: National Center for Education Statistics[/caption]
Overall, changes in enrollment vary widely by state, and growth is often in previously less populated areas. North Dakota is one of seven states where public school enrollment grew from Fall 2019 to Fall 2021 (about 3.5%). In one case, responding to a 25% increase in students from 2019 through 2024 (150 to 200 pupils) Medina Public School in North Dakota broke ground on an expansion project that added 5,330 square feet, some of which will be dedicated to students with special needs.
Fewer than half of states collect representative data on their school facilities. Based on public data, the average age of main instructional buildings in America’s public school system is 49 years. That means many buildings where American school children spend their days are reaching their 50-year design life, where essential facility systems need comprehensive upgrades or replacements. Throughout the U.S., 38% of public school buildings were constructed before 1970, with another 41% split evenly between the years 1970 and 2000 and between 2000 and 2023. Twenty percent of American public schools report that they do not know the construction year of their main instructional buildings. Despite their age, fewer than half of all public school buildings have undergone significant renovations or replacements since their original construction, and fewer than one-third have undergone improvement since 2010.
Fewer than half of states collect representative data on their school facilities. Based on public data, the average age of main instructional buildings in America’s public school system is 49 years. That means many buildings where American school children spend their days are reaching their 50-year design life, where essential facility systems need comprehensive upgrades or replacements. Throughout the U.S., 38% of public school buildings were constructed before 1970, with another 41% split evenly between the years 1970 and 2000 and between 2000 and 2023. Twenty percent of American public schools report that they do not know the construction year of their main instructional buildings. Despite their age, fewer than half of all public school buildings have undergone significant renovations or replacements since their original construction, and fewer than one-third have undergone improvement since 2010.
Defects are common at schools when considering basic needs like reliable electricity, clean drinking water, and cool safe indoor air. According to a 2020 Government Accountability Office (GAO) report, 41% of school districts needed to update heating, ventilation, and air conditioning (HVAC) systems in at least half of their schools, making HVAC repairs the most common infrastructure need across school systems. Meanwhile, at least 28% of school districts must upgrade interior lighting, roofs, and safety or security systems in half of their overall buildings.
Unfortunately, the prevalence of lead in school piping and supply lines is largely unknown. According to a 2023 study of school drinking water infrastructure, 10 states have announced a testing program but have collected little or no data. Sixteen more states have tested for lead pipes in some school districts but collected data from relatively few. The analysis devised a 200-point scale, awarding points to school districts for drinking water best practices. The District of Columbia ranked first with 148 points. South Dakota and West Virginia tied for last at 0 points. South Dakota was planning to start a voluntary EPA-funded testing program in schools.
Montana passed legislation requiring drinking water assessment at school buildings by the end of 2021. However, across the state’s 591 public schools, 149 had not submitted their drinking water assessments by the deadline, primarily owing to a lack of funding for the assessments and high-priority, time-sensitive repairs taking precedence. In Montana, the initial statewide funding for lead drinking water inspections was only $40,000.
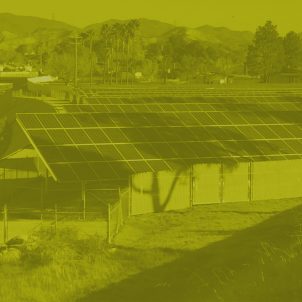
Recently, several states have made efforts to better assess school facilities. Michigan’s Fiscal Year 2024 budget included $20 million to the state Department of Education to perform building audits using best practices and licensed professionals, including civil engineers. Michigan made the funding flexible enough to support evaluations of essential facility functions and innovative capital projects like feasibility studies of solar energy installations.
Tennessee includes school infrastructure needs as part of an annual report from an independent statewide commission. The evaluation breaks down education facility needs into state of good repair work and school expansions or new construction, informing decision- makers on funding and oversight priorities and setting a best practice that other states could follow.

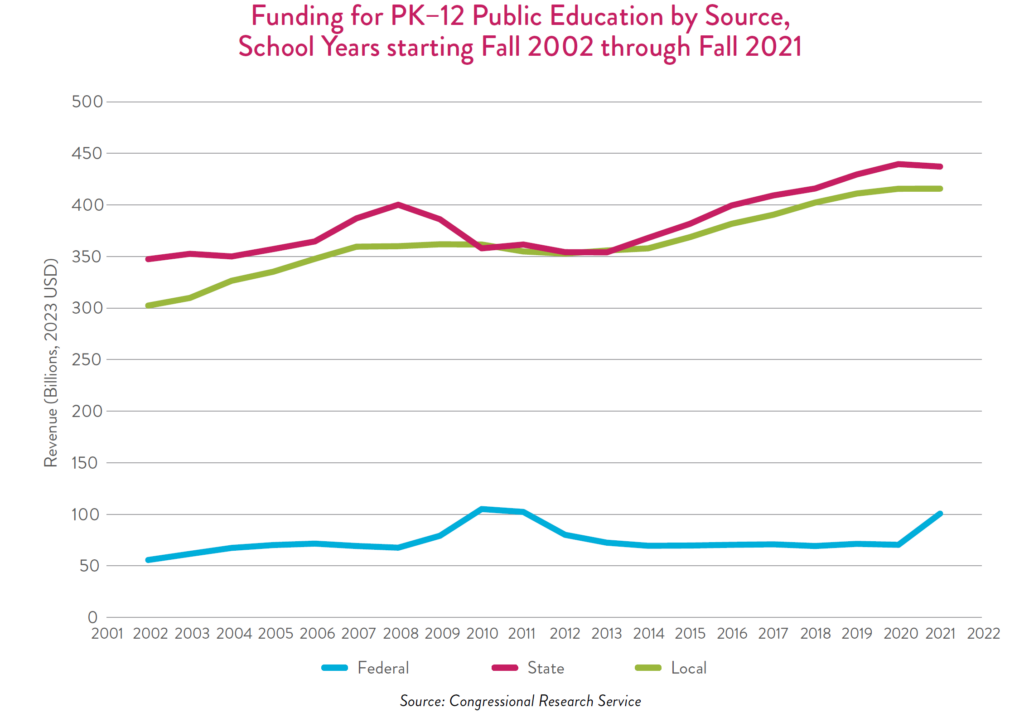
School funding for physical infrastructure is primarily driven by local and state governments, with infrequent increases from federal sources during economic recessions, like 2008–2009’s recession and the downturn from COVID-19.
School funding for physical infrastructure is primarily driven by local and state governments, with infrequent increases from federal sources during economic recessions, like 2008–2009’s recession and the downturn from COVID-19.
About $813 billion in total spending supported America’s public PK–12 schools in SY 2021–22, including $703 billion in operations expenditures and $79 billion in capital costs, with $22 billion in debt service and $9 billion in other programming. Capital costs represent less than 10% of total education spending, and capital budgets skew heavily toward new facilities rather than maintenance of existing infrastructure. Seventy-six percent of capital expenditures ($60 billion) was dedicated toward construction on new sites compared to 7% ($5.7 billion) in land and existing structures expenses. Equipment purchases cover the bulk of the remaining capital budget. Investments at this rate mean the upkeep of buildings is often underfunded and delayed, often to the point where full replacement is needed.
With most of the dedicated annual funds from federal, state, and local government used for school staff payroll and other non-facility operations, support for school facilities is often left to bond or tax measures voted on locally. Voters approved these measures at an average national rate of 76% recently, but approval rates vary greatly by state. In elections held within 2024, every single school bond measure passed in 13 states, but only 56% of those in Ohio and 14% of those in South Dakota cleared the threshold for adoption. Even in states with historically high school bond passage rates, the measures have unpredictable results, adding unpredictability to asset planning. The aforementioned Medina, ND, school expansion was delayed while officials regrouped after losing their first bond measure appeal to voters. In the Kansas City suburbs, Grandview C-4 School District won support from 71% of voters for a 2024 bond issue, partly because the measure did not increase taxes.
Ahead of SY21–22, the federal government delivered $24.2 billion in COVID-19 federal assistance funds. Federal investments into schools included the Coronavirus Aid, Relief, and Economic Security [CARES] Act of 2020, the Coronavirus Response and Relief Supplemental Appropriations [CRRSA] Act of 2021, and the American Rescue Plan Act of 2021 [APRA]. Despite notable attention to HVAC system upgrade projects, only a tenth of that spending ($2.5 billion) went to capital expenditures. Other spending went to maintain safe operations with consumable goods like face masks and additional hiring. Many districts quickly increased their staffing to reduce learning loss during the pandemic. Some states prioritized facility spending more than others, with South Dakota allocating the most federal money to infrastructure and Nevada the least of the 21 states with publicly available data.

In Washington, D.C., the public school system began a facilities modernization process in 2000, and 70% of its square footage was modernized by 2021. The effort was successful because best practices for school facility management were written into District law, and annual appropriations funded facility evaluations. The school system’s asset management practices span from a high- level planning of facility needs through the management of real estate, maintenance of existing assets, construction of new buildings, and mindful disposal and repurposing of land.
Mindful asset management requires staffing dedicated to that purpose, and relatively few members of the education workforce have a portfolio in physical infrastructure. Of the 8 million Americans employed at K–12 schools in 2022, only 4% (300,000) worked in building and grounds cleaning and maintenance.


In 2021, the 21st Century Schools Fund found that America’s investments in public primary and secondary schools trailed the need for state of good repair by $85 billion annually, a 42% increase from $60 billion (2020 dollars) as estimated in 2016. That total includes capital improvement needs as well as maintenance and facility operations. While those repair needs grow—as do the total number of project numbers and inflation-adjusted cost for each—a list of new facility features is moving from “nice to have” to “necessary,” and chief among those “must-haves” is air conditioning.
In 2021, the 21st Century Schools Fund found that America’s investments in public primary and secondary schools trailed the need for state of good repair by $85 billion annually, a 42% increase from $60 billion (2020 dollars) as estimated in 2016. That total includes capital improvement needs as well as maintenance and facility operations. While those repair needs grow—as do the total number of project numbers and inflation-adjusted cost for each—a list of new facility features is moving from “nice to have” to “necessary,” and chief among those “must-haves” is air conditioning.
In the last half-century, daytime temperatures during the first two months and the final two months of America’s traditional school calendar are increasing with hotter temperatures extending further north. The Center for Climate Integrity determined that most schools experiencing 80 degrees and higher for at least 32 days of a school year had air conditioning. Using that baseline and 2025 temperatures, the study estimated that 13,700 additional schools will need air conditioning, totaling more than $40 billion in investment needs.
National weather trends show higher air temperatures further north; as a result, air conditioning retrofits are increasingly needed for schools located higher in latitude. Also, the funding resources of local school districts reveal a disparity: northern state schools in high-income communities may already have A/C installed, but their neighboring districts in lower-income areas may not. The Center identified schools in rural, under-resourced communities needing A/C as far north as Washington, Idaho, Montana, and North Dakota.
[caption id="attachment_19417" align="aligncenter" width="1466"] Need for Cooling Systems at American Public Schools, by County
Source: Center for Climate Integrity, used with permission[/caption]
Traffic safety is a growing concern at school facilities and campuses, in part because American families now drive their kids to school more than ever before. The use of private vehicles for student pickup and drop-off has grown from less than 20% in 1969 to almost 54% in 2022, with only 10% of students now using active forms of transportation like walking or biking. In suburban and rural communities, space is easier to dedicate to safe vehicle loading areas, but streetscapes in those areas are sometimes less safe for people walking or biking.
Traffic safety is a growing concern at school facilities and campuses, in part because American families now drive their kids to school more than ever before. The use of private vehicles for student pickup and drop-off has grown from less than 20% in 1969 to almost 54% in 2022, with only 10% of students now using active forms of transportation like walking or biking. In suburban and rural communities, space is easier to dedicate to safe vehicle loading areas, but streetscapes in those areas are sometimes less safe for people walking or biking.
The increased use of cars overlapping with bus operations has correlated with more pedestrian fatalities in recent years. The issue generates new urgency for engineers to design streetscapes that protect vulnerable road users on campus. Regional planning organizations and state or local departments of transportation have accessed federal money for “Safe Routes to School” since 2005. The Infrastructure Investment and Jobs Act (IIJA) increased funding to the program by $1.4 to $1.5 billion annually, up from $850 million in 2019, and limited the ability of states to redirect the money away from these “transportation alternative” projects. Although the resource is helpful, requests for these funds consistently outweigh availability, and extensive regulatory review at historic campuses hampers project delivery.
Safety in numbers has been the approach of a growing movement, “walking school buses” or “bike buses,” with experienced parents and school officials leading organized groups to and from schools. Success of these programs are higher when financial incentives are provided, and school staff are involved in the operations of each bus for walkers and families biking.
Extreme weather and seismic threats create a greater need for resilient school buildings. From 2017 to 2019, 54% of American school districts received FEMA disaster recovery funds, covering 67% of all students nationwide. Districts serving higher populations of children with low incomes, English-language learning needs, and other social vulnerabilities needed more recovery assistance than school systems in areas with higher incomes.
Extreme weather and seismic threats create a greater need for resilient school buildings. From 2017 to 2019, 54% of American school districts received FEMA disaster recovery funds, covering 67% of all students nationwide. Districts serving higher populations of children with low incomes, English-language learning needs, and other social vulnerabilities needed more recovery assistance than school systems in areas with higher incomes.
The majority of public schools (93%) have some athletic facilities on site, with a gymnasium most frequently reported at 69%. Those large spaces can be helpful for schools to serve as command centers and shelters during disasters. A 2021 University of North Carolina study showed demonstrated benefits of schools supporting disaster recovery in the aftermath of Hurricanes Matthew (2016) to Florence (2018).
One example of a school serving community resilience is River Grove Elementary School in Lake Oswego, OR, which serves residents who need to evacuate. The school was recently rebuilt to withstand seismic events and to generate and store electricity on site with a microgrid. The facility, welcoming students in Fall 2024, was designed with high-performance building codes and structural integrity on par with a hospital or fire station.
These upgrades typically come with high up-front costs, although they save money over time with reduced financial risks. The Batesville School District in Arkansas estimates that an initial investment toward solar power generation and conservation of water and electricity usage will result in $4 million of savings from utility bills over 20 years. School leaders can seek creative funding sources to bridge the gap between up-front costs and accumulated savings.
One such source is competitive grants from the Renew America’s Schools program housed within the U.S. Department of Energy, which helps schools perform energy retrofits and upgrade HVAC systems. Another federal funding opportunity for schools is USDA’s Rural Development Electric programs.
Data show increasing extreme “heat day” closures at public schools each of the last few years. Schools in Baltimore and Detroit closed early in September 2023 just as they had done in May of that year, as the previous school year was ending. Philadelphia Public Schools moved their first school days from August 2023 to early September to mitigate heat closures suffered in the previous year, but 86 schools in the Philadelphia system ended up dismissing early anyway during the full opening week of SY23–24.
To meet resilience needs and implement the latest research on public health, some state and local governments are rethinking school facility design. In Oakland, CA, the public school system partnered with Trust for Public Land to create green spaces out of campus playgrounds. Natural landscape elements reduce extreme heat on hardtop play surfaces and improve social and emotional well-being of students. One 2024 study estimated that most California public schools have less than 5% tree canopy, a measure of land area that is naturally shaded. Tree planting also assists with stormwater management, a task with infrastructure regulations from which some school districts are exempt, like the Los Angeles Unified School District.
Finally, broadband is key at school facilities where teachers now upload lesson plans, communicate digitally with parents, and even deliver multimedia instruction to students using devices for class in person. In 2023, 74% of public school districts met a Federal Communications Commission benchmark on bandwidth per student, up from 67% and 59% in the previous two years. Increased connectivity came with annual improvements in an affordability metric and coincided with a surge in federal money to states for broadband deployment and improvements.


Solutions that Work
Photo Attributions

Select your home state, and we'll let you know about upcoming legislation.
"*" indicates required fields
Back