Georgia, Inland Waterways, National Category
Startup Uses Drone for Cleaning Water, Collecting Data


Roads connect communities and play a vital role in the nation’s economy. Although Americans’ travel patterns have shifted in the years following the COVID-19 pandemic, vehicle miles traveled (VMT) have rebounded. Some 39% of major roads in the U.S. are in poor or mediocre condition, an improvement from the 43% recorded in 2020. Driving on deteriorated and congested roads still costs the average driver over $1,400 per year in vehicle operating costs and lost time. While once again declining, the number of people dying on America’s roads remains high, totaling 40,990 in 2023. Furthermore, the impacts of extreme weather events present challenges for maintaining existing roads and planning future projects. Recent investments, including more than $591 billion since late 2021 from the Infrastructure Investment and Jobs Act (IIJA), are a positive step. The nation’s roadways still face a $684 billion funding gap over the next 10 years. Sustained and robust infrastructure investment is needed to maintain and improve the roadway network for the future.
America’s more than 4.1 million miles of public roadways form a vital network, facilitating the movement of people and goods. This interconnected system consists of roads, sidewalks, dedicated lanes for transit vehicles, and bike lanes. The road network is maintained by government agencies and private sector entities, who handle responsibilities ranging from snow removal and traffic management to traveler information services and signage.

lost 43 hours to traffic congestion
in 2024
80% of its purchasing power
since it was last raised in 1993
occur in rural areas, where only 19%
of the U.S. population lives
The nation’s roads have had to accommodate increased vehicle travel and a growing population in recent years. Roads with the highest speeds and the highest volumes of traffic are generally prioritized for funding and therefore are typically in the best condition. Based on miles, the share of pavements on roads eligible for federal funding with good ride quality improved between 2008 and 2018, rising from 40.7% to 47.2%. However, the share of federal-aid highway pavements with poor ride quality also grew during this period, increasing from 15.8% to 22.6%. Deteriorated roads result in additional operating costs in the form of vehicle repairs and tire wear. Additional vehicle operating costs totaled $725 per motorist in 2023.
The nation’s roads have had to accommodate increased vehicle travel and a growing population in recent years. Roads with the highest speeds and the highest volumes of traffic are generally prioritized for funding and therefore are typically in the best condition. Based on miles, the share of pavements on roads eligible for federal funding with good ride quality improved between 2008 and 2018, rising from 40.7% to 47.2%. However, the share of federal-aid highway pavements with poor ride quality also grew during this period, increasing from 15.8% to 22.6%. Deteriorated roads result in additional operating costs in the form of vehicle repairs and tire wear. Additional vehicle operating costs totaled $725 per motorist in 2023.

The pandemic brought with it an increase in teleworking and affected how people used or did not use roads. Hybrid jobs (employees worked from home at least one day per week) increased from 4.1% in 2020 to 5.7% in 2021. The number of vehicle trips to and from work declined from 53.1 million in 2017 to 41.3 million in 2022, a 28% drop. Yet “commute VMT” remained at a little less than one-third of total VMT between these years.

In addition to an increase in working from home, travel shifted across other modes. Americans opted for modes such as biking, which allowed them to socially distance. The Bureau of Transportation Statistics indicates national expenditures on bicycles and related accessories increased in the years following the pandemic’s start, and total bikeshare ridership on six of the largest systems increased 42% from March 2020 to March 2023.
Over the last few years, the pattern of road use has changed due to increased remote work and other factors. The Federal Highway Administration (FHWA) has found that morning and evening peak periods include not only commutes but also shopping trips, school drop-off and pick-up runs, and other nonwork trips. School trips in particular have experienced a shift. In 2022, 53.2% of U.S. students were dropped off at school or drove themselves rather than take the bus, bicycle, or walk. This figure represents an increase from 46.4% in 2009.
After dipping drastically due to the pandemic, VMT has rebounded to nearly 2019 levels, reaching 3.19 trillion miles in the U.S. in 2023, a slight increase from 2022.
The typical U.S. driver lost 43 hours to traffic congestion and $771 worth of time in 2024, up from 42 hours and $733 in 2023. These amounts of time lost are equivalent to spending one work week per year sitting in traffic. Congestion negatively affects people headed to their destinations and goods on their way to market. While congestion has traditionally been reported, travel time reliability has increasingly measured roadway network performance. A reliable network allows for consistent travel times during peak period trips; drivers can accurately plan for extra time. Significant challenges occur when the network is unreliable, delaying people and products.
Freight transportation also affects the roadway system. One consideration with trucks, and vehicles in general, is their weight’s impact on pavement. Vehicle weight, from sedans to minivans, has increased over the past 40 years, and electric vehicles are heavier still due to their batteries. Trucking accounts for the largest share of freight movement, and freight moved by truck is expected to increase 91% by value and 53% by weight between 2022 and 2050.

The IIJA contained a five-year reauthorization of federal surface transportation programs for Fiscal Years 2022 through 2026, including $273.2 billion over five years in formula funding for states through the federal-aid highway program. The IIJA represented a nearly 50% increase in highway funding from the previous surface transportation reauthorization. Since the law’s enactment, construction work has started on 207,000 miles of roadways.
The IIJA contained a five-year reauthorization of federal surface transportation programs for Fiscal Years 2022 through 2026, including $273.2 billion over five years in formula funding for states through the federal-aid highway program. The IIJA represented a nearly 50% increase in highway funding from the previous surface transportation reauthorization. Since the law’s enactment, construction work has started on 207,000 miles of roadways.
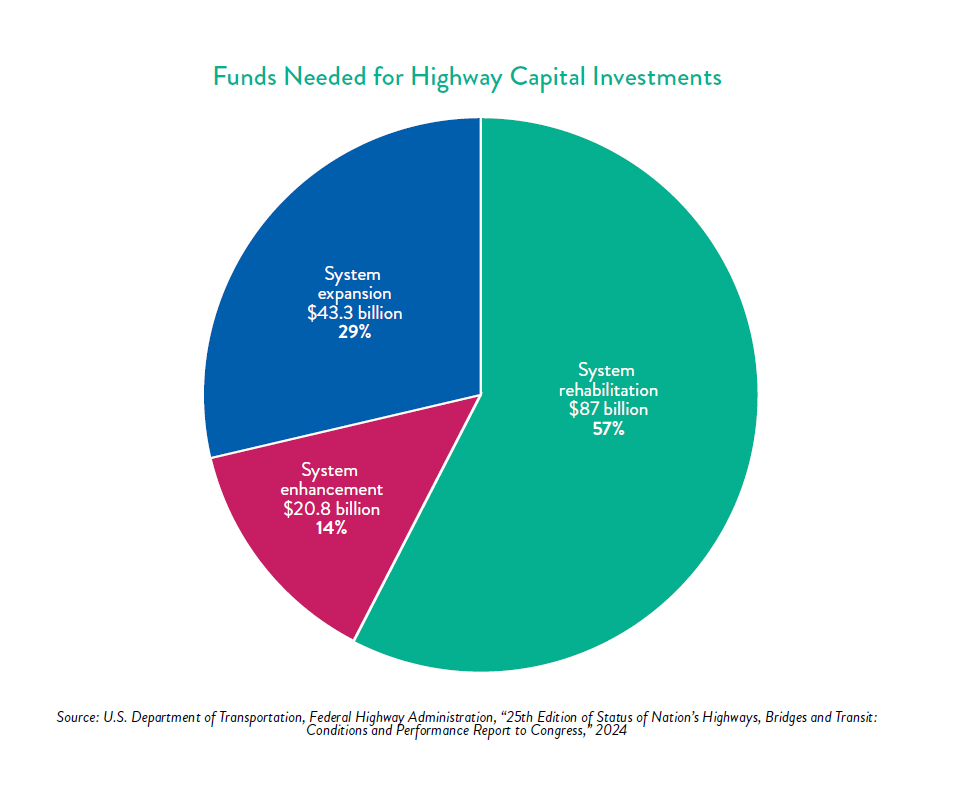
Because of years of underfunded roadway maintenance, the transportation system has staggering needs. According to ASCE’s Bridging the Gap report, surface transportation needs from 2024 to 2033 total about $3.5 trillion, of which $2.2 trillion represents the nation’s roadway system. If funding levels included in the IIJA become the new baseline for annual investment, the nation’s roadways will have a funding gap of $684 billion over the next 10 years. As of 2018, FHWA estimated $1.1 trillion was needed to address a backlog of highway and bridge investments over 20 years.To fund all potential highway capital investments from 2018 to 2038, some $151.1 billion in average annual investments would be needed, with $87 billion directed toward system rehabilitation, $20.8 billion to system enhancement, and $43.3 billion to system expansion.
Transportation funding in the U.S. has generally followed a “user pay” principle, meaning people who use a service, such as a road, should bear its costs. Federal road investment relies on the Highway Trust Fund, a user fee–funded source supported by motor fuel tax revenue. The federal motor fuel tax rate of 18.4 cents per gallon for gasoline and 24.4 cents per gallon for diesel has not been raised since 1993. The U.S.’s federal fuel tax rate is lower than other industrialized countries. For example, Germany’s excise tax on gas is $2.76 per liter, and France’s is $2.81 per liter.The growth in construction costs and the fuel efficiency of vehicles means that the purchasing power of the federal gas tax has declined 80% since 1993. Between 2013 and 2024, 34 states have approved or adjusted motor fuel tax increases.States have also explored mechanisms such as electric vehicle (EV) registration fees, EV charging station taxes or fees, and road usage charge (RUC) programs.
Voters have demonstrated support for transportation funding measures at the state level and the IIJA represents a substantial investment, but reliable federal funding is still needed to maintain and modernize the transportation system. Investment needs are outpacing available revenue owing to declining fuel tax receipts, aging infrastructure, and in some cases, budget cuts. At the same time, many states are struggling to update their revenue sources to keep pace with inflation and mitigate the impacts of revenue losses caused by electric and fuel-efficient vehicles.

Government agencies and private sector entities work together to operate and maintain the nation’s transportation system. Each state is required by federal law to develop a risk-based asset management plan for the National Highway System to improve or preserve system condition and performance. Achieving and maintaining a state of good repair on existing roadways is essential. Life-cycle cost analysis, which helps provide awareness of total infrastructure cost, can help transportation professionals and elected officials make well-informed Operation and Maintenance decisions.
Government agencies and private sector entities work together to operate and maintain the nation’s transportation system. Each state is required by federal law to develop a risk-based asset management plan for the National Highway System to improve or preserve system condition and performance. Achieving and maintaining a state of good repair on existing roadways is essential. Life-cycle cost analysis, which helps provide awareness of total infrastructure cost, can help transportation professionals and elected officials make well-informed Operation and Maintenance decisions.
America will never be able to build its way out of congestion. Roadway expansion can often fail to meet travelers’ expectations for reduced congestion and improved reliability due to induced demand. For example, the Katy Freeway, which carries Interstate 10 and connects Houston with its western suburbs, was widened to 26 lanes of traffic in the mid-2000s. Although travel times on the route declined right after the project’s completion, within a few years, they had exceeded previous levels. Similarly, a $1 billion effort to improve traffic along I-405 in Southern California resulted in slower travel times for drivers.

According to NHTSA, 891 people died in work zone traffic incidents in 2022, a decrease from 963 in 2021. The number of bicyclists killed in traffic crashes has trended upwards since 2010. From 2010 to 2021, bicyclist fatalities ranged from 623 to a high of 966, with a yearly average of 800. Approximately 7,318 pedestrians were killed in traffic crashes in 2023, according to the Governors Highway Safety Association. While this figure represents a 5.4% decrease from the previous year, it is still 14.1% higher than 2019 levels.

Safety remains a significant issue on the nation’s roadways. The National Highway Traffic Safety Administration (NHTSA) estimates 40,990 people died in motor vehicle traffic crashes in 2023, an average of 112 deaths per day. The amount of people dying on America’s roadways per year is equal to four airplanes full of passengers crashing every week.
Safety remains a significant issue on the nation’s roadways. The National Highway Traffic Safety Administration (NHTSA) estimates 40,990 people died in motor vehicle traffic crashes in 2023, an average of 112 deaths per day. The amount of people dying on America’s roadways per year is equal to four airplanes full of passengers crashing every week.

Traffic safety is a particular concern in rural areas, where only 19% of the U.S. population lives and 47% of all roadway fatalities occur.
Although there has been a slight drop in traffic deaths in recent years, numbers are still high. NHTSA’s research suggests that, throughout lockdowns associated with the pandemic, drivers engaged in more risky behavior, such as speeding and refusing to wear a seat belt. Traffic fatalities in the U.S. tower over those reported by other countries. A study of 31 nations found that the U.S. had the second-highest fatality rate of 12.8 deaths per 100,000 people in 2022, trailing only Colombia.
Traffic safety is a particular concern in rural areas, where only 19% of the U.S. population lives and 47% of all roadway fatalities occur. Challenges with rural roads include a lack of safety features, such as rumble strips, ample shoulders, recoverable slopes, lighting, and a lack of quick access to emergency medical care. Rural roads play a critical role in the movement of freight, which also presents safety implications for the individuals who live near them and use them. In 2022, 5,837 trucks were involved in a fatal crash, a 1.8% increase from 2021 and a 41.6% increase since 2012.
In addition to causing deaths and injuries, traffic crashes are expensive. According to a NHTSA report, the total economic cost of motor vehicle crashes in the U.S. in 2019 was $340 billion, or about $1,035 for every person in the country.
Pedestrian, bicyclist, and work zone safety are also important issues, because these users of the transportation system are particularly vulnerable to vehicles.
Among the most pressing challenges for roads are the impacts of extreme weather, which the transportation sector itself exacerbates. Transportation accounted for the most significant portion (28%) of total U.S. greenhouse gas emissions in 2022. Most of these emissions (80%) came from cars and medium- and heavy-duty trucks. Rising temperatures, fires, flooding, erosion, and severe weather strain the nation’s roadways. In addition to planning and building resiliently for the future, state departments of transportation (DOTs) need to ensure their existing infrastructure can support daily operations and facilitate the movement of people evacuating areas affected by extreme weather events. Evacuations are necessary to move people out of harm’s way; however, they can stress transportation networks, snarl traffic, and present safety concerns. One particularly fraught example is the evacuation preceding Hurricane Rita, which hit less than a month after Hurricane Katrina and forced an estimated 3.7 million people to evacuate the Houston area. The evacuation resulted in more than 100 deaths. In contrast, the Caldor Fire in the summer of 2021 required an organized evacuation of more than 50,000 residents from California to Nevada and did not result in any fatalities.
Among the most pressing challenges for roads are the impacts of extreme weather, which the transportation sector itself exacerbates. Transportation accounted for the most significant portion (28%) of total U.S. greenhouse gas emissions in 2022. Most of these emissions (80%) came from cars and medium- and heavy-duty trucks. Rising temperatures, fires, flooding, erosion, and severe weather strain the nation’s roadways. In addition to planning and building resiliently for the future, state departments of transportation (DOTs) need to ensure their existing infrastructure can support daily operations and facilitate the movement of people evacuating areas affected by extreme weather events. Evacuations are necessary to move people out of harm’s way; however, they can stress transportation networks, snarl traffic, and present safety concerns. One particularly fraught example is the evacuation preceding Hurricane Rita, which hit less than a month after Hurricane Katrina and forced an estimated 3.7 million people to evacuate the Houston area. The evacuation resulted in more than 100 deaths. In contrast, the Caldor Fire in the summer of 2021 required an organized evacuation of more than 50,000 residents from California to Nevada and did not result in any fatalities.

Emerging technologies and policies present opportunities to improve traffic flow and safety. Alexandria, VA, a suburb of Washington, DC, ended 2023 with zero traffic fatalities after adopting several strategies, including speed limit reductions, speed cameras in school zones, and “no turn on red” restrictions. Hoboken, NJ, has not had a traffic fatality since January 2017 due to steps such as removing parking spaces near intersections and lowering speed limits. Artificial Intelligence (AI) also has the potential to improve traffic flow, as demonstrated on I-15 in Nevada through a pilot program led by government partners and a mobility company.
State DOTs have made organizational changes to lead innovative activities. Within the DOTs of Colorado, Connecticut, Delaware, Pennsylvania, and Utah, new entities were created to handle issues such as vehicle electrification, innovative finance, climate change, and new technologies. Several state DOTs have taken on roles related to emerging technologies (such as automated and connected vehicles and drones), often as partners in exploring these technologies and their impacts.


Solutions that Work
![]()
The indicator for pavement ride quality is the International Roughness Index, which measures the cumulative deviation from a smooth surface in inches per mile.35 The FHWA has found that a road surface with an International Roughness Index (IRI) rating below 95 provides good ride quality, a road with an IRI from 95 to 170 provides fair ride quality, and a road with an IRI above 170 provides poor ride quality.
Photo Attributions

Select your home state, and we'll let you know about upcoming legislation.
"*" indicates required fields
Back