Georgia, Inland Waterways, National Category
Startup Uses Drone for Cleaning Water, Collecting Data


As Americans increasingly depend on electrification in their daily lives, energy demand is experiencing its highest growth in two decades. An increase in electric vehicles (EVs) and a rise in data centers will demand 35 gigawatts (GW) of electricity by 2030 alone, up from 17 GW in 2022. This rapid acceleration, compounded by federal and state net-zero greenhouse gas emissions goals, means utilities will need to double existing transmission capacity to connect new renewable generation sources. Transmission investments have risen by $5 billion from 2017 to 2022, and the Infrastructure Investment and Jobs Act (IIJA) and Inflation Reduction Act (IRA) are supporting renewable technologies and grid hardening measures. New investments come as weather accounts for 80% of electricity outages since 2000, most of which occurred in the last decade and within distribution systems that deliver power in the last miles from transmission systems to homes and businesses. Interregional connections accelerated by streamlined regulatory review, rigorous design standards, and resilient technologies must be implemented to ensure reliability in the years ahead.
U.S. energy infrastructure consists of facilities and related infrastructure needed to generate electricity from various sources (natural gas, petroleum, coal, solar, wind, nuclear, hydroelectricity), and transmission and distribution (T&D) networks needed to move this energy from its source to communities nationwide. To best serve the needs of the public, balanced investments in both generation and T&D systems are essential to ensure reliable performance. These investments, largely driven by user rates, can prevent disruptions to energy services that have become critical to the nation’s safety, health, and economic efficiency. Energy interruptions bear significant costs on U.S. industries and consumers, as even a brief power outage increases production costs and disrupts supply chains.


to power approximately 80,000 U.S. homes. Combined with AI and electrified products such as EVs,
American energy demands are surging
through 2026 to modernize the electric grid, however, the sector still faces a $578 billion investment gap
due to shifting needs and growing demands
stem from severe weather events, but the use of the most up-to-date codes and standards, which could prevent future system failures,
is not always required
Energy Generation
The U.S. is undergoing a transformational shift in how energy is used and generated through more than 12,500 utility-scale electric power plants. Consumers and businesses are growing increasingly reliant on data storage facilities, artificial intelligence (AI), and electrified products such as EVs, to name just a few examples of advancements adding immense strain to an already fragile and aging electric grid. Data centers alone are expected to demand 35 GW of electricity by 2030, up from 17 GW in 2022, growing roughly 10% per year.
[site_chart id="19221"]Electricity peak demand growth is at its highest point in two decades. After years of stable growth, summer and winter peak demands are expected to increase 15% and 18%, respectively, by 2034. Yet, traditional resources such as coal needed to supply that demand are being retired, and new weather-dependent resources are merely replacing the lost generation rather than matching demand growth.

These rising energy demands are occurring in conjunction with national and state policy changes meant to reduce carbon emissions and reliance on fossil fuels, which have historically served as the most reliable energy sources. Renewable sources have become more efficient and cost- effective in recent years, coinciding with 22 states and the District of Columbia (DC) establishing net-zero carbon emission goals. In addition, 29 states and DC have adopted Renewable Portfolio Standards (RPS), which encourage improved reliability of renewable systems. Grants and subsidies from the 2022 IRA have further incentivized renewable energy generation. Consumer trends and policy changes are beginning to have an effect. U.S. energy- related CO2 emissions declined by 3% in 2023, largely credited to the decrease of coal-fired generation.
New generation or storage projects must submit interconnection requests to be added to the grid. The lengthy request process, which can take an average of 35 months to complete, and coordination with all stakeholders is cited by developers as the leading cause of project delays and cancellations, and this has led to interconnection queues increasing nearly eightfold in the past decade and by 30% in 2023 alone. Nearly 2,600 GW of generation and storage capacity is seeking grid interconnection. The Federal Energy Regulatory Commission (FERC) adopted interconnection reforms in 2023 to speed up this process, but they have not taken effect in most regions.
Despite the turn to industrial and consumer electrification, natural gas still plays a dominant role in energy generation, providing 42.3% of total energy generation in the U.S. in 2023. In 2022, the nation’s 3 million miles of natural gas pipelines delivered more than 29 trillion cubic feet of natural gas to more than 78 million consumers. The U.S. has 129 operable refineries, down from 135 in 2020, which produced just over 19 million barrels per day in 2023, about 1 million less than in 2020.
Roughly half of the existing gas pipeline network was installed in the 1950s and 1960s, further emphasizing the need to invest in maintenance, upgrades, and expansion of the network to reduce the risk of delivery bottlenecks or leakage events, which are still occurring with some regularity. Oil and gas system improvements are primarily funded by regulated owner rates and limited recovery; upgrade investments are typically driven by urgency and necessity rather than through asset management and life- cycle cost-based planning. For example, following Winter Storm Uri in Texas in 2021, the state’s Public Utilities Commission required power plants to winterize to prevent future blackouts from occurring, but lawmakers did not require the Texas Railroad Commission, which regulates the gas industry, to quickly impose weatherization standards.
More than 36 GW of solar is expected to be added to the grid in 2024, nearly doubling 2023’s 18.4 GW increase, which itself was a record. Developers and power plant owners are making record yearly expansions to utility-scale electric-generating capacity and battery storage capacity. In 2024, the U.S. nearly doubled its existing 15.5 GW battery storage capacity with an additional 14.3 GW coming online.
Solar is expected to compose 58% of new electric energy capacity additions in 2024. Wind will add 8.2 GW of capacity in 2024, 13% of new energy capacity, after a record addition of more than 14 GW in both 2020 and 2021. Natural gas is expected to add 2.5 GW of planned capacity additions, the lowest annually added in 25 years.
Transitioning to renewable energy also has emphasized energy storage to safeguard the grid when renewable sources are not at peak performance. There are approximately 40 GW of battery storage in the U.S., with 8 GW installed in 2023. Utility-scale batteries now account for 48% of all energy storage in the U.S., up from just 6% in 2018.
The remaining 22 GW of energy storage comes from pumped storage hydropower (PSH), which has the lowest impact to global warming of any energy storage technologies.
The U.S. currently has 43 PSH plants with the potential to double PSH capacity. For example, Alaska has 1,800 suitable locations for new PSH facilities to bolster the state’s energy reliability. The majority of PSH plants were built in the 1970s, and U.S. PSH investment has been stagnant since the 1990s, in part due to increased costs and permitting. Since the passage of the IRA, PSH projects are now eligible for a tax credit of up to 30% the project cost.
NERC reports over 83 GW of fossil-fired and nuclear generator retirements are currently anticipated through 2033. Increased renewable and natural gas generation has offset the loss of coal-fired generation, but sector wide generation outlooks fail to keep up with surging demands. The time to plan, go through lengthy environmental review and permitting processes, construct and bring a renewable energy resource online, and go through interconnection requests can take anywhere from 2 to 4 years for solar or onshore wind projects and 5 to 10 years for offshore wind. Constructing a data center, which consumes the equivalent of 80,000 homes’ worth of energy, can be completed in just over one year, creating capacity challenges.
Electric vehicles are also complicating the energy sector’s ability to maintain sufficient capacity. In March 2021, an Executive Order was issued that 50% of all cars sold in the U.S. by 2030 must be net-zero greenhouse gas emitters. The IIJA allocated $7.5 billion to build a national network of EV chargers, but some estimates indicate the nation will need closer to $40 billion in charging infrastructure investment to achieve 100% passenger EV sales by 2035.
 Source: U.S. Energy Information Administration[/caption]
Transmission and Distribution
Energy is channeled through the nation’s 600,000 miles of transmission lines (240,000 miles of which are considered high-voltage lines) and more than 5.5 million miles of local distribution lines with over 180 million power poles. Transmission lines are frequently referred to as the “interstate highway” of the electric grid, while the smaller distribution lines they feed into, often referred to as the “last mile” of the grid, would be akin to local roads taking you directly to your destination. As of 2024, more than 28,000 miles of transmission development is anticipated over the next 10 years, which is significantly higher than 2023’s 10-year estimate of 18,675 miles. Most of this development is in the planning stage to connect to new sources.
Substation transformers and distribution transformers are responsible for stepping up or down voltage levels from transmission lines or isolating electrical circuits during transfer to the distribution network. Substation transformers are facilities that convert high-voltage power to manageable levels for the distribution network, whereas distribution transformers are smaller devices attached to distribution poles that further convert voltage to safe and efficient levels for industrial, commercial, and residential users. More than 79,000 substation transformer facilities exist in the U.S., and these facilities are vulnerable to intentional attacks and damage from severe weather events.
There are more than 60 million distribution transformers nationwide, which could triple by 2050 to account for rising demands. The U.S. currently faces a shortage of distribution transformers owing to supply chain bottlenecks and few domestic manufacturers to choose from. Distribution transformer capacity will need to rise 160%–250% by 2050 to meet anticipated needs, but inventory backlogs threaten the ability to meet current or future demands. As of June 2024, acquiring new transformers faces lead times ranging from 80 to 210 weeks (120 weeks on average), up from 50 weeks in 2021. The cost of transformers has risen 60%–80% since January 2020. Transformer installation delays will slow down implementation of new energy projects and put the grid at risk if in-place transformers fail.
Electricity T&D losses averaged about 5% of the electricity transmitted and distributed in the U.S. in 2018–2022. In addition, 70% of power transformers are 25 years or older, 60% of circuit breakers are 30 years or older, and 70% of transmission lines are 25 years or older.
As energy demands grow, aging assets need to be replaced or modernized. Experienced employees retire, and utilities expect to add 10,700 power-line installer and repair job openings each year over the next decade. Energy sector jobs grew by 3% in 2023, which is 50% more than all U.S. employment growth. Energy jobs jumped from 8.1 million in 2022 to 8.35 million in 2023.
Despite making up only 6% of the number of electricity providers, investor-owned utilities (IOUs) serve 72% of U.S. electricity consumers, with the remaining 28% owned by government utilities, independent power producers, or cooperatively owned utilities.
Efforts are ramping up to increase interregional transmission lines. This includes a recent $1.3 billion IIJA investment to construct three proposed interregional lines across six states: the 175-mile Southline Transmission Project (New Mexico to Arizona); the 211-mile Twin States Clean Energy Link (New England to Quebec, Canada); and the 214-mile Cross-Tie Transmission Line (Utah to Nevada). An additional 35 GW of transfer capability across the U.S. would improve reliability during extreme weather events.
In 2022, Americans experienced roughly 5.5 hours of electricity disruptions, down from 7.5 hours in 2021. Failures within distribution systems make up 92% of electric service interruptions, largely due to severe weather events, vegetation, vandalism, and less stringent standards than are applied to the transmission network.
Added Capacity by Source (in gigawatts)
Utility operators rely on rate payers to fund maintenance, capital improvement, and expansion projects for both energy generation and T&D systems. Commercial rates and residential rates differ to account for the loads they require, as commercial users often purchase in bulk and can negotiate rates.
TRANSMISSION AND DISTRIBUTION
U.S. utilities combined to spend $27.7 billion on transmission and $50.9 billion on distribution infrastructure in 2023. In comparison, utilities spent $20 billion on transmission systems and $44.5 billion on distribution in 2022, marking significant increases to replace aging equipment, modernize existing assets to be more resilient, and install new lines and transformers.
Utility operators rely on rate payers to fund maintenance, capital improvement, and expansion projects for both energy generation and T&D systems. Commercial rates and residential rates differ to account for the loads they require, as commercial users often purchase in bulk and can negotiate rates.
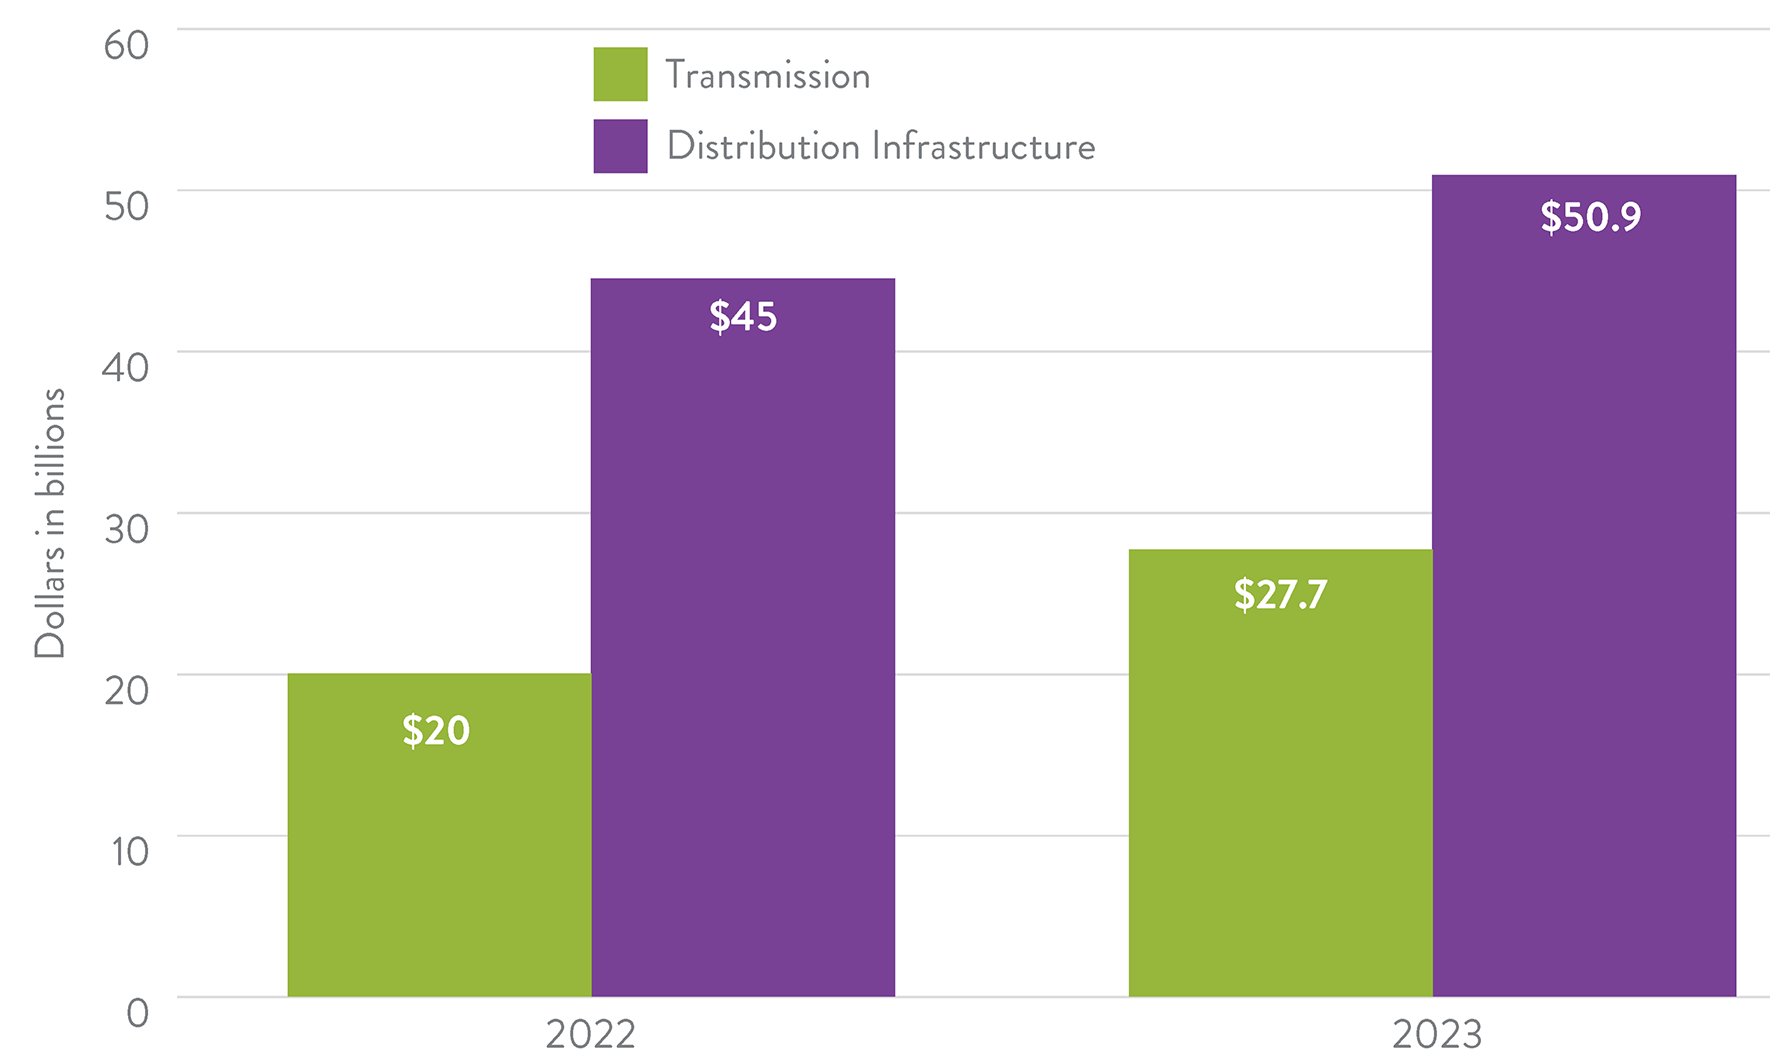 Source: Edison Electric Institute[/caption]
In 2023, electric utilities requested $13.51 billion in rate increases, and gas utilities requested $4.62 billion. Increased rates reflect significant capital expenditure plans to update aging infrastructure, install new technologies to accommodate the clean energy transition, and prepare for extreme weather events.
Although some regions have chosen to freeze or slow rate increases to promote affordability for businesses and residents, this can lead to more extreme rate increases to catch up on lost revenue, which are difficult for consumers to adjust to.
Energy Generation
State Renewable Portfolio Standards (adopted by 29 states and DC) and federal decarbonization initiatives, coupled with surging energy demands, are leading to rapidly escalating funding needs in the generation and T&D sectors, despite an influx of investments. Even if funding levels established by the IIJA and IRA are reauthorized in 2026, the energy sector faces a $578 billion investment gap by 2033, which climbs to $702 billion by 2033 if the nation “snaps back” to pre-IIJA/IRA funding levels when the bills expire.
The 2022 IRA allocated $386 billion for climate and energy spending, with most of that funding dedicated toward new or expanded tax credits that promote clean energy generation, electrification, green technology retrofits for homes and buildings, greater use of clean fuels, and wider adoption of and preparation for EVs. Rural electric cooperatives received more than $13 billion to advance clean energy generation and resilience, reliability, and affordability initiatives.
The IIJA allocated $1 billion over five years in grant funding to the first-ever Natural Gas Distribution Infrastructure Safety and Modernization (NGDISM) grant program to repair, rehabilitate, or replace natural gas distribution pipeline systems. Despite being the leading source of energy generation, initiatives to move toward renewable or clean energy sources have reduced the incentive to expand or modernize natural gas pipelines. Lack of rehabilitation or capital improvement projects can jeopardize energy stability throughout the U.S., especially with so many refineries and pipelines located along the Gulf of Mexico, frequently exposed to extreme storms.
As U.S. power producers shift away from fossil fuels, the economics of renewable energy have dramatically improved. Between 2012 and 2022, solar and battery costs declined 80%, while offshore wind and onshore wind costs went down by 73% and 57%, respectively. In October 2020, the Energy Information Administration (EIA) announced that solar generation had surpassed combined cycle natural gas generation as the lowest-cost generation available.
Transmission and Distribution
In 2022, IOUs spent $26.7 billion on transmission investment, up from $25.1 billion in 2021. These utilities are projected to spend $32.1 billion in 2026, marking a total of $121 billion in transmission construction investments by IOUs between 2023 and 2026. Distribution investments by IOUs are also rising, from $46.1 billion in 2021 to $47.6 billion in 2022. Adaptation, hardening, and resilience measures made up 34% of transmission investments and 37% of distribution investments by IOUs in 2022.
U.S. utilities combined to spend $27.7 billion on transmission and $50.9 billion on distribution infrastructure in 2023. In comparison, utilities spent $20 billion on transmission systems and $44.5 billion on distribution in 2022, marking significant increases to replace aging equipment, modernize existing assets to be more resilient, and install new lines and transformers. In 2023, utilities spent $11.8 billion on underground power lines and $7.5 billion on distribution transformers, a 23% increase on transformer investments since 2022 owing to supply chain issues. They also invested $6.1 billion in substation equipment, a 15% increase from 2022.
The IIJA allocated $73 billion from 2021 to 2026 to modernize the electric grid, build thousands of miles of new power lines, and expand renewable energy. Much of the funding is dedicated to hardening T&D lines to be more resilient. Hardening measures include undergrounding overhead power lines, implementing fire-resistant technologies, and replacing poles and other structures with stronger, more durable materials.
Energy Generation
Despite oil and gas pipelines aging beyond their intended design lives and severe weather events increasing in frequency, the Pipeline and Hazardous Materials Safety Administration (PHMSA) indicates that significant pipeline incidents are decreasing in frequency. The per-year average of serious pipeline incidents from 2021 to 2023 is 266, compared to the 5-year (2019–2023) average of 280 per year and 10-year (2014–2023) average of 294 per year.
Annual fatalities from these incidents have stayed level at 12, while injuries are lower on average between 2021 to 2023 at 30 per year, compared to 33 from 2019 to 2023 and 50 from 2014 to 2023. Since 2021, significant pipeline incidents have caused more than $1.6 billion in property damages, with 2022 accounting for nearly $1.2 billion of the share.
Transmission and Distribution
Although power outages in 2022 were down from 2021, any form of power outage can have health and safety risks. As experienced during Winter Storm Uri in Texas, electricity is required to run hospitals, heat in freezing temperatures, cool air in extreme heat, and keep alarm systems active. Electric reliability is also necessary for managing water systems, opening locks along inland waterways, and managing dams during storms.
T&D systems and electric substations have been the subject of vandalism and cybersecurity breaches in recent years, bringing into question the safety of consumers and businesses who depend on these services. DOE reports that 95 human-related electric disturbances took place in the first half of 2023, the most of any six-month stretch in the 21st century. In response, the IIJA invested more than $1 billion in cybersecurity measures for programs such as the Cyber Response and Recover Fund, the Department of Homeland Security (DHS) Science and Technology Directorate for Research and Development, DHS’s Cybersecurity and Infrastructure Security Agency, and Office of the National Cyber Director. Mitigating these threats is essential as hackers become more advanced and AI increases cyber vulnerability, while consumers rely on electricity for an increasing number of daily functions. More interconnections between regions provides additional access points for hackers and can increase the likelihood of cybersecurity failures, broadening the need for sharing information between grid operators and cybersecurity specialists.
transmission and distribution
Between 2000 and 2023, 80% of U.S. power outages stemmed from weather events, such as severe wind, rain, and thunderstorms; snow, ice, and freezing rain; hurricanes; and extreme heat. The U.S. experienced two times more weather-related outages during the last 10 years (2014– 2023) than during the prior 10 years (2000–2009).
Energy Generation
As severe weather events become more frequent, U.S. energy operators must build networks with stronger materials and techniques to mitigate those threats.
For example, the solar industry is losing $2.5 billion annually from equipment underperformance, often caused by thinner panels being hit by hailstones. Installing panels with higher tilt angles can make them more hail-resilient by mitigating direct impacts, but this tactic also makes panels more susceptible to wind. Wind turbines have been known to catch fire, although rare, and turbine blades cannot be recycled, although technologies are emerging to address this issue, which has harmful environmental impacts.
Microgrids only make up 0.3% of U.S. electricity but are gaining popularity, growing 11% from 2018 to 2022 and providing 3.1 GW of power. The 460 microgrids currently in the U.S. are one way to combat extreme weather events, as they are less susceptible to single failure points because the source is more localized. However, densely populated areas typically do not have the space for a microgrid, and communities that rely on them must have dedicated electricians able to provide swift repairs in the event of damage or outages or risk prolonged power outages.
Transmission and Distribution
Between 2000 and 2023, 80% of U.S. power outages stemmed from weather events, such as severe wind, rain, and thunderstorms; snow, ice, and freezing rain; hurricanes; and extreme heat. The U.S. experienced two times more weather-related outages during the last 10 years (2014–2023) than during the prior 10 years (2000–2009).
The IIJA invested heavily in grid resilience, establishing the $10.5 billion Grid Resilience and Innovation Partnerships (GRIP) Program. Roughly $5 billion was administered to GRIP for projects that demonstrate innovative hardening and resilience approaches to transmission, storage, and distribution infrastructure. The law also allocates $1 billion over 5 years to modernize and improve rural grid resilience.
Consensus-based codes, standards, and manuals of practice are available to help build more resilient T&D networks; however, these are often not required, leading to system failures in the face of extreme weather events.
Power lines under 60 feet in height, which make up most wood poles in the country, are not required to be built to withstand severe storms and are often impacted by encroaching vegetation, leading to frequent failures. More than 90,000 wood distribution poles were destroyed in Louisiana during Hurricane Katrina, and more than 65,000 poles were destroyed across New York and New Jersey in Superstorm Sandy. After Hurricane Katrina, local provider Entergy raised its rates by 7.5% to account for the damages incurred, including destroyed wood poles. Although wood poles can typically be reinstalled quicker than alternate materials, they are often rebuilt to the same low reliability level, setting up a cycle of failure followed by restoration that is not sustainable.
To restore power as quickly as possible, building codes currently do not require providers to replace fallen poles with stronger poles that are less likely to fail. Instead, historically, a pole is allowed to be replaced under the same specifications that were used for installing the destroyed or damaged pole.
For resiliency solutions, advancement in smart grid technologies can improve operational efficiency and reduce the risks of outage events. By identifying potential risks in real time, providers can predict and address problems before they arise. Smart Grid Grants through the GRIP Program has announced $3 billion across 34 projects nationwide meant to improve and expand smart grid technologies.
Furthermore, AI has the potential to further enhance smart grid functionality. AI can identify peaks of production and consumption in renewable energy; forecast power loads and generation with more precision; automate switching to reroute energy or isolate affected areas before severe damages occur during outage events; and detect intrusion and malware associated with cyberattacks.
Finally, undergrounding power lines improves grid reliability. California’s Pacific Gas & Electric Co. (PG&E) is currently undergrounding 10,000 miles of its overhead power lines, which has the potential to reduce the risk of wildfire by 98%.
Although undergrounding is an attractive option, the process is costly, and repairs to damaged lines take more time with steeper maintenance costs compared to an overhead line. In the case of California and PG&E’s program, burying lines costs from $1.85 million to $6.1 million per mile, compared to $634,000 to $760,000 per mile for building new overhead transmission lines. Nationwide estimates for the cost of undergrounding power lines are closer to $1 million per mile.


Solutions that Work
Photo Attributions

Select your home state, and we'll let you know about upcoming legislation.
"*" indicates required fields
Back