Georgia, Inland Waterways, National Category
Startup Uses Drone for Cleaning Water, Collecting Data


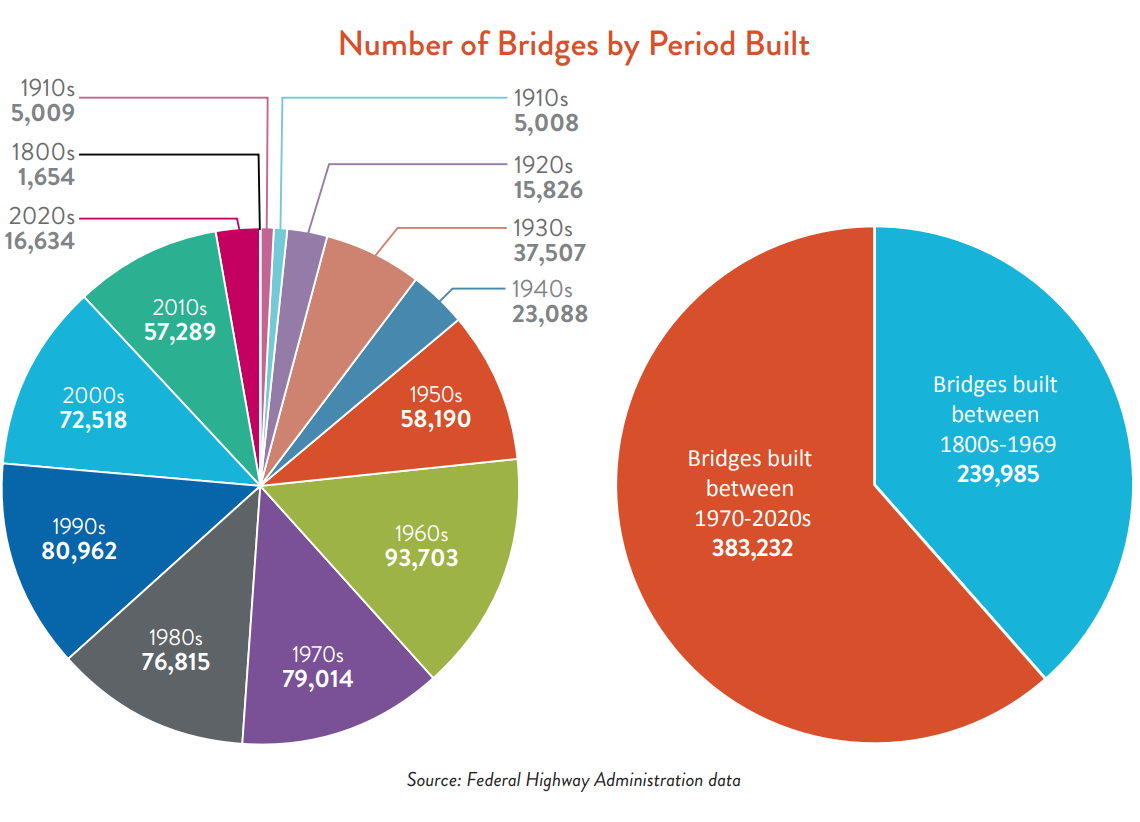
There are more than 623,000 bridges across the country, of which 49.1% are in “fair” condition, 44.1% are in “good” condition, and 6.8% are in “poor” condition. Unfortunately, the nation continues to see the number of fair bridges surpassing those in good condition. As bridges in fair condition continue to age—presenting the possibility of being further downgraded—they also exemplify an opportunity because they can be preserved at a lower cost than bridges in poor condition. Bridges received a substantial boost through the Infrastructure Investment and Jobs Act (IIJA), including $27.5 billion for the Bridge Formula Program and $12.5 billion for the Bridge Investment Program. Despite this infusion of federal funding, bridge-related system rehabilitation needs are estimated at $191 billion. Therefore, strategic asset management planning and routine maintenance are essential to keeping bridge conditions from further declining and avoiding costly repair or rehabilitation work. While the effects of extreme weather events pose threats to bridges, innovative techniques are improving their security and resilience.
There are 623,218 bridges in the country, with an average age of about 47 years, that serve as vital connections throughout the transportation system. Many bridges are approaching or have exceeded the 50-year life they were designed for. However, they are still expected to withstand the impacts of a changing climate, continued maintenance challenges, and higher traffic volumes and vehicle weights than they were built to support.
of bridge replacement, a bridge that is built today
will need to last 126 years
into a state of good repair over the next 10 years, an additional
$373 billion in funding is needed.
across the country are susceptible to
extreme storm events
In 2024, over 4.9 billion motor vehicle trips were taken daily across the nation’s 623,218 bridges, slightly more than the daily trips recorded in 2021. Of these bridges, 49.1% are in fair condition, 44.1% are in good condition, and 6.8% are in poor condition—a number that has continued to decline over the past few years.
In 2024, over 4.9 billion motor vehicle trips were taken daily across the nation’s 623,218 bridges, slightly more than the daily trips recorded in 2021. Of these bridges, 49.1% are in fair condition, 44.1% are in good condition, and 6.8% are in poor condition—a number that has continued to decline over the past few years.

State-owned and locally owned bridges reflect this trend. In 2024, 42.9% of state-owned bridges were in good condition, while 52.6% were rated fair and 4.4% were rated poor. Meanwhile, 45.3% of locally owned bridges were in good condition, 45.8% were rated fair, and another 8.9% were rated poor.
Although bridges in poor condition are not necessarily unsafe, they require replacement or significant rehabilitation work and present a higher risk of future closure or weight restrictions.
Across the nation, the percentage of bridges in poor condition has continued to improve, dropping from 8.7% in 2014 to 7.3% in 2020 to 6.8% in 2024. Mirroring this trajectory is the percentage of bridge deck area classified as poor. In 2014, some 6.7% of bridge deck area was in poor condition. By 2024, that figure had dropped to 4.9%. More than 168 million trips were taken across poor bridges every day in 2024, which is a decrease from the 178 million trips taken over poor bridges five years ago but still represents 3.4% of daily trips.
Less encouraging is the trend for bridges in good condition. Over the last few years, while the percentage of bridges in poor condition has decreased, so has the percentage in good condition. Some 44.8% of bridges were in good condition in 2021, while 44.1% were rated in good condition in 2024.
As the number of bridges in good and poor condition has decreased, the number of bridges classified as fair has increased, presenting both challenges and opportunities. Although bridges in fair condition continue to age, with the potential of being downgraded to poor, they can also be preserved at a lower cost than is necessary to address a bridge in poor condition.
Furthermore, 63,085 of the nation’s 623,218 bridges were posted for load in 2024, meaning they have restrictions regarding the weight of vehicles that can safely cross. In addition to presenting safety concerns, posted bridges can cause heavy vehicle operators to take alternate routes, increasing travel time for emergency response vehicles, commercial trucks, and school buses.
About a third of the nation’s bridge inventory (221,791 spans) needs repair work or replacement. Approximately 45% of bridges have exceeded their planned design lives of 50 years. However, since 2007, new highway bridges are required to have a minimum 75-year design life. Although infrastructure owners have worked to maintain a state of good repair, bridges will need to be kept in service well past their anticipated initial design lives. Between 2014 and 2023, about 4,927 bridges per year were replaced. At that rate, bridges built today will need to last 126 years.

Chronic underinvestment has resulted in a substantial financial need for bridges. The Federal Highway Administration’s (FHWA) most recent assessment from 2018 estimated that $1.1 trillion was needed to address an existing backlog of highway and bridge investments. System rehabilitation needs for bridges are estimated at $191.3 billion. As of 2023, FHWA estimates the cost to replace poor bridges totals $69.7 billion, while rehabilitation costs are $47.4 billion. ASCE’s Bridging the Gap report indicates there is a funding gap of $373 billion over 10 years to bring the nation’s bridges into a state of good repair.
Chronic underinvestment has resulted in a substantial financial need for bridges. The Federal Highway Administration’s (FHWA) most recent assessment from 2018 estimated that $1.1 trillion was needed to address an existing backlog of highway and bridge investments. System rehabilitation needs for bridges are estimated at $191.3 billion. As of 2023, FHWA estimates the cost to replace poor bridges totals $69.7 billion, while rehabilitation costs are $47.4 billion. ASCE’s Bridging the Gap report indicates there is a funding gap of $373 billion over 10 years to bring the nation’s bridges into a state of good repair.
Substantial investment in bridges at the federal and state levels has occurred over the last few years, reflecting positive movement to address these immense needs. The IIJA contained a five-year reauthorization of federal surface transportation programs for Fiscal Years 2022–2026 and boosted infrastructure spending via supplemental appropriations. The IIJA also created the Bridge Replacement, Rehabilitation, Preservation, Protection, and Construction Program (Bridge Formula Program), which provides $27.5 billion over five years, and established the competitive Bridge Investment Program, which provides $12.5 billion over five years to help plan, replace, rehabilitate, and preserve bridges. A total of $21.2 billion was apportioned through the Bridge Formula Program between FY22–25. As of November 2024, just over $8 billion has been awarded through the Bridge Investment Program. Since the enactment of the IIJA through the first quarter of FY25, 12,306 new bridge projects have been initiated, ranging from substantial upgrades of significant corridors such as the Brent Spence Bridge, which links Ohio and Kentucky, to smaller studies of bridge needs in Philadelphia and Utah.
[caption id="attachment_19290" align="aligncenter" width="2048"] Source: Brent Spence Bridge Corridor Project[/caption]
Although the federal excise tax rate of 18.4 cents per gallon on gasoline and 24.4 cents per gallon on diesel has not budged since 1993, states have demonstrated initiative in adjusting fuel taxes to generate revenue for transportation infrastructure projects. Between 2013 and 2023, 34 states have approved or adjusted motor fuel tax increases. As vehicles have become more fuel efficient and electric cars more commonplace over the last 20 years, the purchasing power of the fuel tax has declined. The U.S. federal fuel tax rate is lower than other industrialized countries. For example, Germany’s tax on gas is $2.76 per liter, and France’s is $2.81 per liter.
Since the purchasing power of fuel taxes has declined, states have enacted additional and alternative transportation funding mechanisms. As of 2024, 39 states have established an electric vehicle registration fee, and eight states have enacted an EV charging station tax or fee. Four states have set up an optional road usage charge (RUC) program, and 18 are conducting pilots, studies, or research on RUC programs.
To handle bridges’ specific needs, state departments of transportation develop and use Transportation Asset Management Plans (TAMPs), which outline systematic, data-based approaches to managing their bridge inventories. The federally required TAMPs predict and set targets for the number of bridges in good or poor condition over the next 10 years. Strategic asset management planning is one of the most cost-effective ways the nation addresses its aging and deteriorating bridge inventory.
To handle bridges’ specific needs, state departments of transportation develop and use Transportation Asset Management Plans (TAMPs), which outline systematic, data-based approaches to managing their bridge inventories. The federally required TAMPs predict and set targets for the number of bridges in good or poor condition over the next 10 years. Strategic asset management planning is one of the most cost-effective ways the nation addresses its aging and deteriorating bridge inventory.
Life-cycle cost analysis is a critical component of asset management. When the cost of a bridge replacement, rehabilitation, or repair project is estimated for budgeting purposes without considering the long-term costs of maintenance, operation, and retirement, many decisionmakers are left with an underestimated value for their planning purposes. Bridges are costly and complex assets that provide decades of service and using life-cycle cost analysis can minimize long-term costs with a broad upfront picture of the costs over a bridge’s lifetime.
Maintenance lessons can be learned from the collapse of Pittsburgh’s Fern Hollow Bridge, which took place in January 2022 after experiencing a structural failure. The National Transportation Safety Board (NTSB) concluded that critical lapses in maintenance and oversight by multiple agencies led to the bridge’s collapse. Although previous inspections had repeatedly documented issues with the bridge, maintenance and repairs were not performed to resolve these issues. Additionally, Pennsylvania Department of Transportation (PennDOT) contractors conducted inspections that did not comply with guidance and failed to identify fracture-critical areas on the bridge’s legs.
Certain states have found success in collaborating with their local government counterparts and tasking them with bridge maintenance decisions. In Louisiana, for example, many of the state’s poor condition bridges were on the local system. The state transportation department gave parishes money to manage those bridges, and parishes, in turn, chose to do robust maintenance rather than replacements. The result was that, even with limited resources, parishes could perform maintenance work on bridges to keep them functioning.

Resilience to natural and human-made disasters is essential in designing, rehabilitating, and replacing critical infrastructure, and bridges are no exception. Many of the country’s older bridges are susceptible to frequent weather-related disasters such as flooding, potentially resulting in overtopping, washout, and other storm damage. Approximately 22,420 bridges were found to be susceptible to overtopping or having their foundations undermined during extreme storm events.
Resilience to natural and human-made disasters is essential in designing, rehabilitating, and replacing critical infrastructure, and bridges are no exception. Many of the country’s older bridges are susceptible to frequent weather-related disasters such as flooding, potentially resulting in overtopping, washout, and other storm damage. Approximately 22,420 bridges were found to be susceptible to overtopping or having their foundations undermined during extreme storm events.
Bridge failures can negatively affect other infrastructure systems, leading to impacts beyond the cost of replacing the bridge and the loss of human lives. Vessel and truck collisions with bridges, exemplified when a cargo vessel strike caused the Francis Scott Key Bridge in Baltimore to collapse in March 2024, can cost lives, thwart commercial operations at ports, and lead t costly detours for drivers. The potential for these collisions poses an additional challenge to designing and protecting bridges. Fender systems, “dolphins,” and islands surrounding piers are options for pier protection, as cargo vessels have grown larger than many bridges were designed to accommodate.
Additionally, bridges are being subjected to trucks heavier than those they were originally designed to carry. These heavier trucks and potential truck convoys threaten to overstress bridge elements, cause metal fatigue and cracking, and decrease the design life of bridges. Bridges could see further stress as future opportunities to platoon connected or autonomous trucks become more commonplace. The great challenge moving forward is to support the hundreds of thousands of existing bridges so they can provide decades of continued, safe service despite a greater frequency of extreme weather events and an increase in design loads.
Engineers are using innovative design requirements, materials, and technologies to enhance the security and resilience of bridges. Various materials and techniques have been developed to maintain the design life of bridges. Materials that can add strength and durability to bridges include high-performance steel, stainless steel, ultra-high-performance concrete, and self-healing concrete (to fix minor cracks). Improved coatings for steel such as galvanizing or metalizing can also increase design life. Remote monitoring of embedded sensors that have been placed in bridges and ultrasound tests of concrete can help engineers identify problems earlier, while drones present an option to assist in obtaining data during bridge inspections.

Bridge failures in recent years have provided opportunities to use innovative techniques. For example, innovative construction materials and ingenuity expedited the reopening of Interstate 95 in Philadelphia after a bridge collapsed in June 2023. Workers used foam glass aggregate (made from recycled glass) to build temporary travel lanes, allowing traffic to return to I-95 and relieving congestion.

Solutions that Work
Photo Attributions

Select your home state, and we'll let you know about upcoming legislation.
"*" indicates required fields
Back